|
|
|
|
|


|
|
Diagram Designer - fGIS Page Layout Module
|
| |
|
When
you use the Export Image commend in fGIS, you are given an option
to open the image in Diagram Designer.
Diagram Designer is a technical illustration and page layout module.
The program offers flexibility to add descriptive features to
maps such as headers, legends, logos and non-spatial symbols.
A few of Diagram Designer's highlights:
-
1. Map
images can be annotated with a collection of geometric, text
and symbol objects stored in template palettes. The active
palette can be changed by right-clicking the template and
browsing to the palette you want to use. Vector, image and
grouped objects can be saved to template palettes. A variety
of mapping symbol palettes is included with the fGIS distribution.
-
2. Page
content can be distributed to four separate layers, making
it possible to add, move or edit features on one layer without
accidentally changing underlying material. A base map and
form header, for example, can be placed on the global template
layer and text or symbols on other layers.
-
3. Users
can create their own palettes of frequently used symbols or
other objects. Just arrange symbols on a page and then convert
the scheme to a template and save it.
-
4. Diagram
Designer offers many text formatting options (including superscript
and subscript). By converting text to a metafile, it can be
rotated or resized.
-
5. Projects
can have custom page sizes of any dimensions, or Diagram Designer
can retrieve the page size specified in the printer setup.
Send the project to your printer or save it in a number of
vector or image file formats.
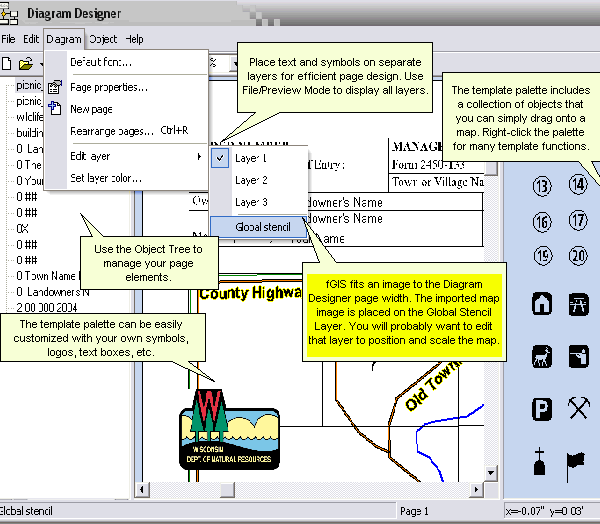
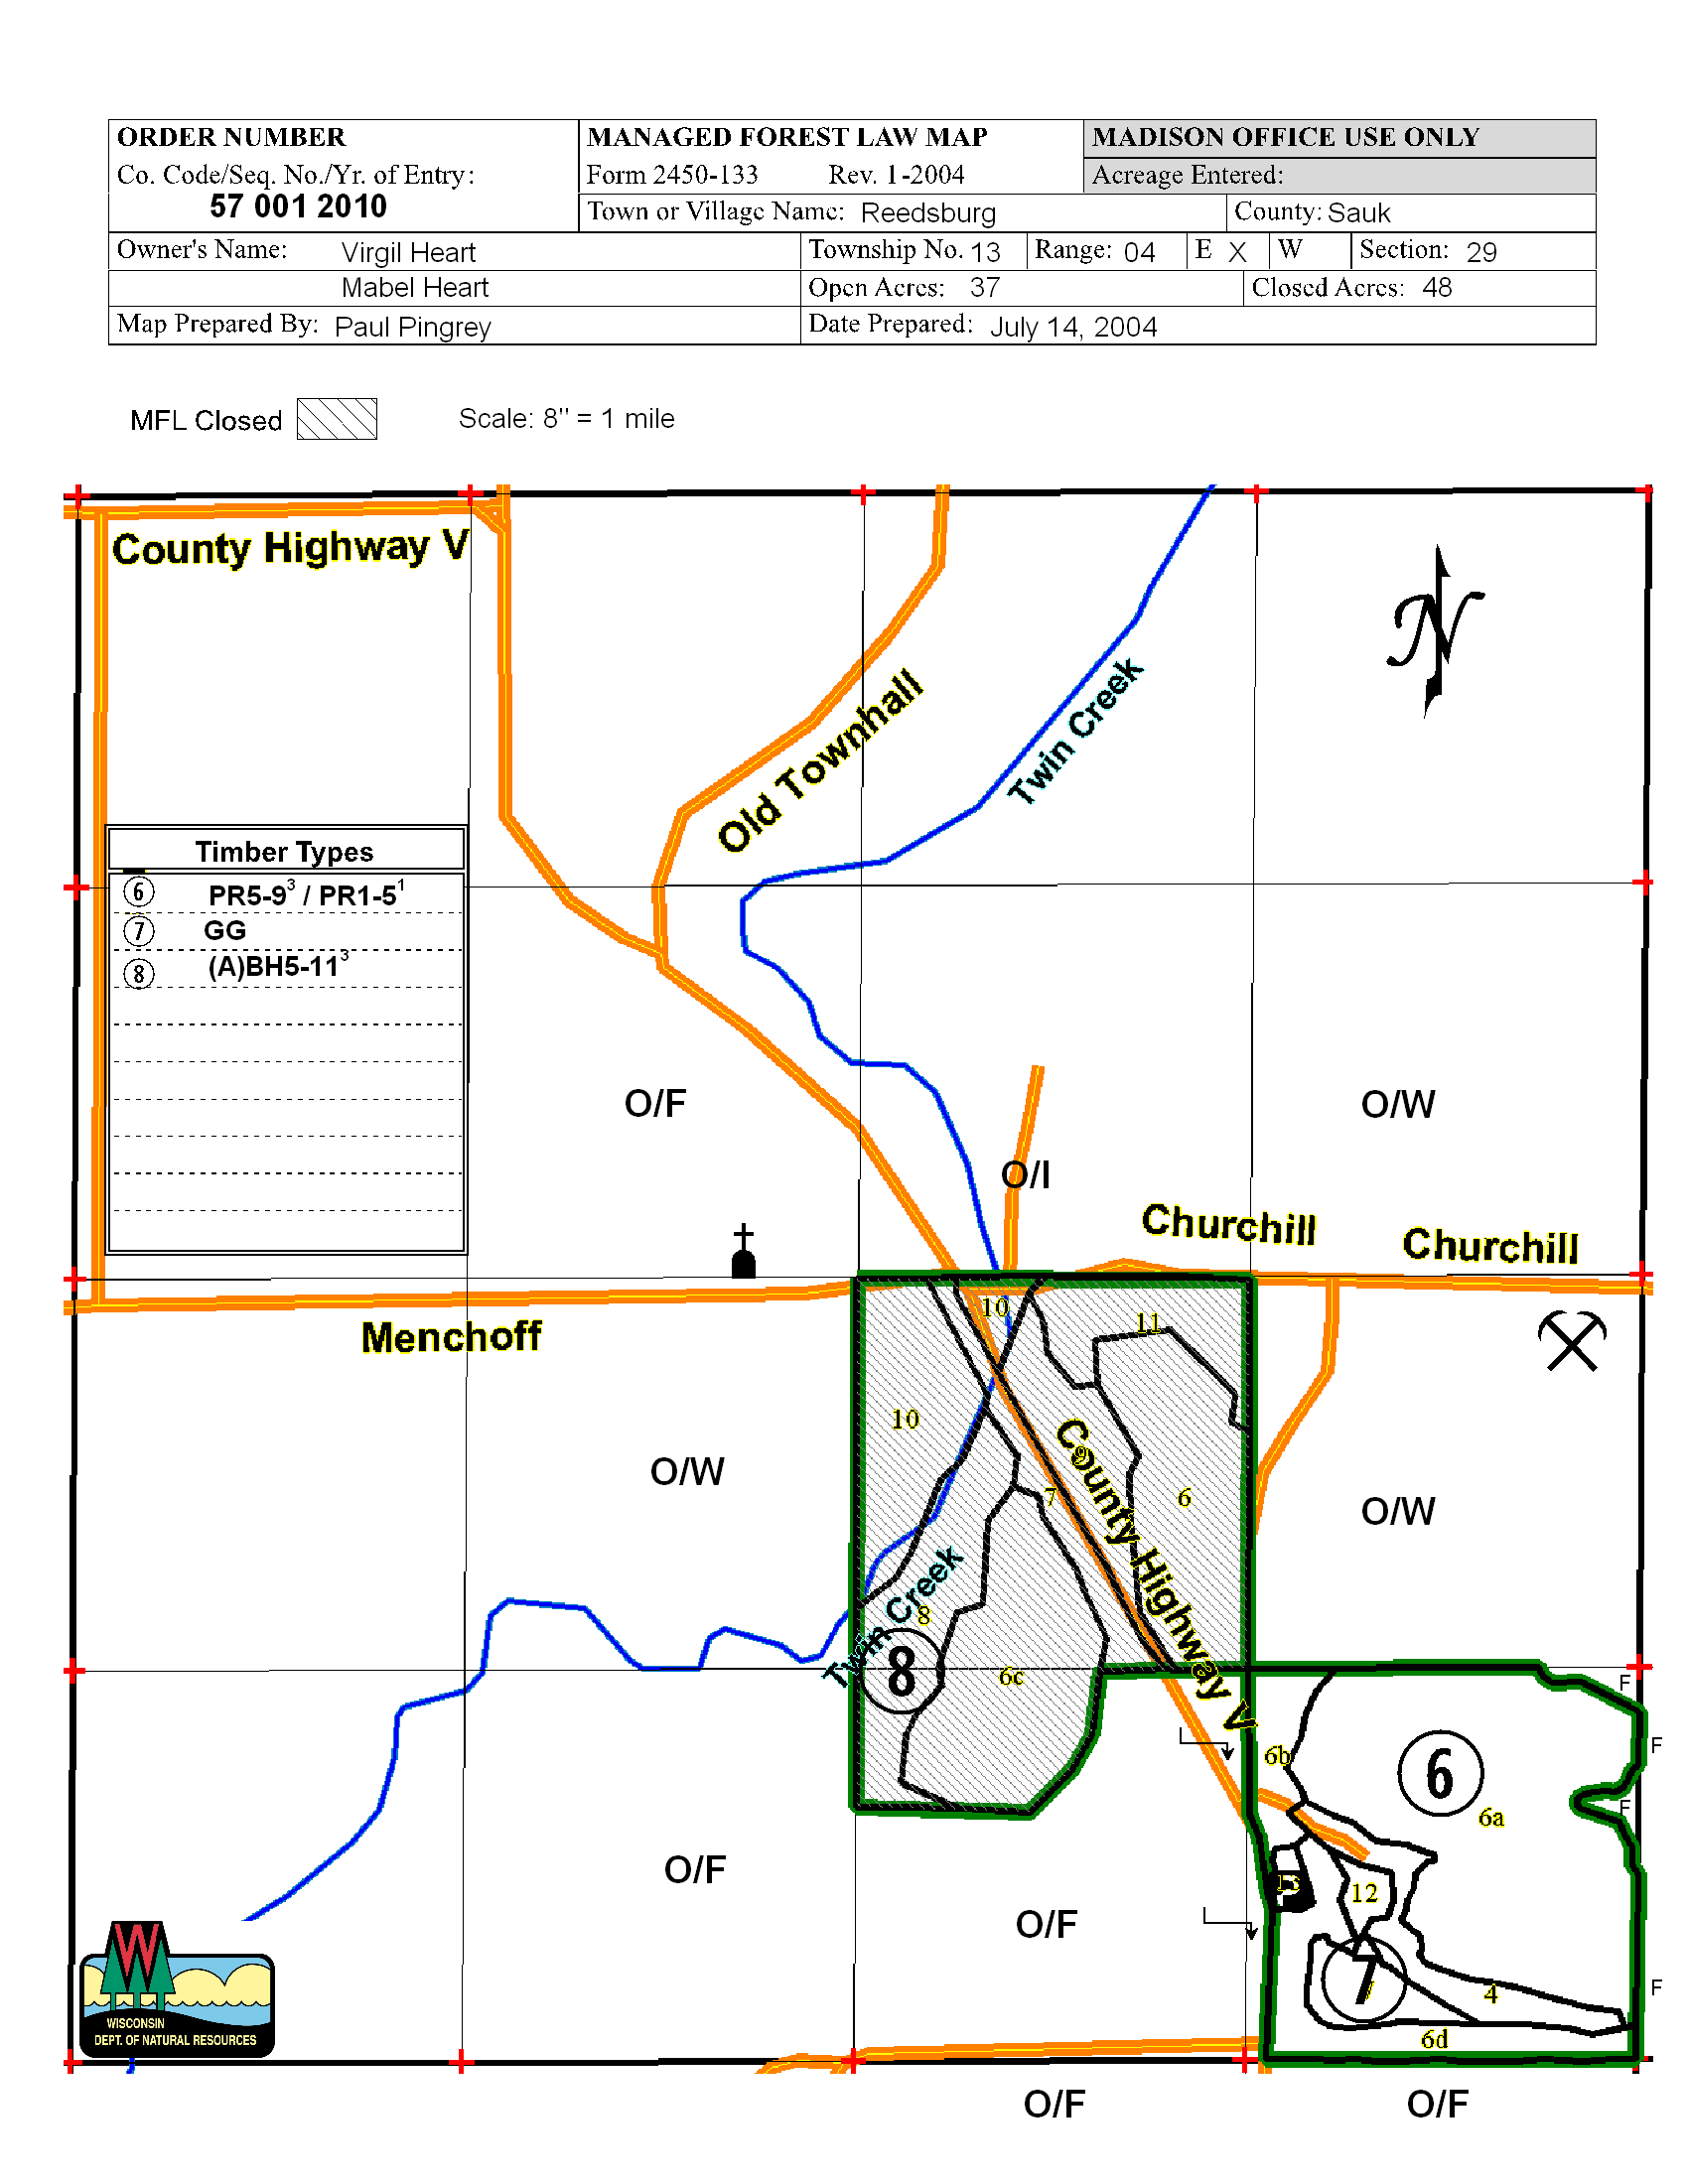
As
shown in the annotations above, fGIS fits the map image to the
Diagram Designer page width. The image is placed on the "Global
Stencil" layer. You will need to edit the Global Stencil
layer (Diagram>Edit layer>Global stencil) to move or resize
the map. Switch back to layers 1, 2 or 3 to add or edit text and
symbols. (By keeping different objects on separate layers, you
can easily move them around without inadvertently changing something
else.)
Note
that if you want to see all four layers simultaneously, make them
all visible with the File>Preview Mode command. Otherwise,
only the Global Stencil and the current active layer are visible.
|
|
Steps for Printing a Wisconsin MFL Map at
8" to the Mile
|
|
1.
In fGIS, zoom into the PLSS section that you intend
to print. Fill the view with the section. (The recommended
monitor resolution for this procedure is 1024 x 768.)
2.
Turn off any image layers or vector layers that you
do not want to print (un-check the layers in the Table
of Contents).
3. Click
the Image Export Tool:
4. Draw
a bounding box around the PLSS section you want to print.
(Pull a box down and right with your mouse, holding
down the left mouse button. Release the left button
after the box is complete.) Position the box a few pixels
outside the section lines in order to capture the section
lines as part of the image.
|
|
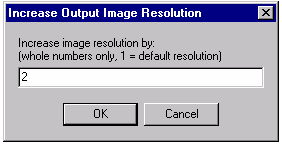
5. In
the dialog box that opens, increase the image resolution
to 2. Less than 2 might result in jagged lines in the
map image.
|
|
6. Click
OK, and save the image as a PNG (Portable Networks Graphic)
image. Give a file name and save it in an appropriate
folder. (PNG files are relatively small but save crisp,
well-defined lines.)
|
|
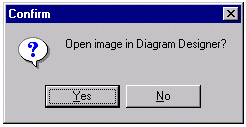
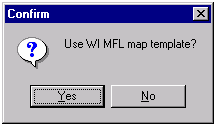
7. Say
yes to open the image in Diagram Designer and yes to
use the MFL map template:
Type
in a document name, click save, and Diagram Designer
will open.
|
|
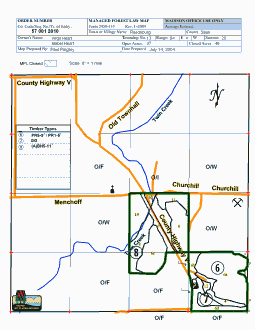
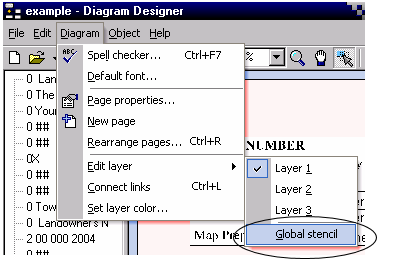
8. You'll
see the exported image on the Diagram Designer map page,
but it will be too small. To change the size and position
of the image, you will need to edit the "Global
stencil" layer. Pick that layer from the Diagram>Edit
Layer>Global Stencil menu.
|
|
9. Change
the zoom level in Diagram Designer to 50% so you can
see the whole map page (use the zoom drop-down in the
tool bar).
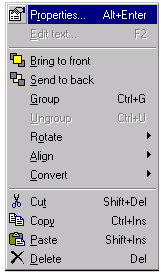
Click
on the pick tool: 
Left
click on the map image to select it. Right-click the
image and choose Properties.
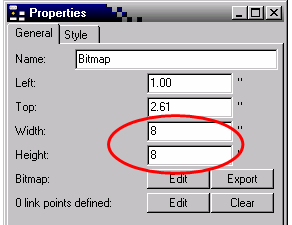
In
the Properties dialog, change the width and height to
8 inches. (If you haven't already done so, set the units
in Diagram Designer to inches through the File>Options
menu.) Note that if your PLSS section is not perfectly
square, you can set the height to an appropriate value
either greater or less than eight inches, but keep the
width at eight. (You can calculate the correct proportions
by checking the width to height ratio with the measure
tool in fGIS.) Click OK and use the mouse to center
the map image on the MFL map form.
|
|
10. Use
the Diagram>Edit Layer>Layer 1 menu to switch
editing to Layer 1. (This will prevent you from inadvertently
moving the map image once you have it positioned.) Click
the Save icon.
Drag
a North arrow, map scale text or other symbols and annotation
marks from the symbol palette on the right onto the
map. The objects can be resized or rotated by pulling
the handles of selected objects or by right-clicking
them and changing properties.
|
|
11. To
edit the MFL map header, zoom into it and left-click
the text you want to change. Tap the F2 key to open
the Edit Text Dialog:
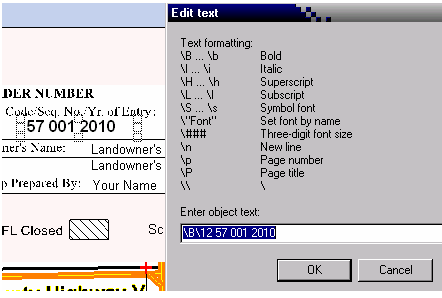
The
first part of the text string is formatting codes. In
the above example, the font is set as bold, 12 point
(\B\12). If you don't specify a font, Arial 10 pt. is
the default. The text MFL number follows a space. Click
OK to accept the changes. The text can include a combination
of regular type and superscript formatting, which is
useful for timber type annotations.
|
|
12. Once
everything is positioned and the text is correct, use
File>Print to produce the output.
Save Your Diagram Designer File.
|
|
|
|
|
|