|
|
There are four basic categories of
geographic data:
- Images (e.g., aerial photos, scanned
maps, satellite imagery, screen captures)
- Lines, Points and Areas (roads,
streams, power lines, lakes, county boundaries, topographic
lines, well sites, section corners, tower locations, etc.)
- Elevations (arrays of terrain heights)
- Spatial Databases (census data, resource
inventory data, spatial event data, etc.)
Mapping data comes in dozens of different formats, projections,
scales and file compression schemes. For a brief explanation of
the types of data you are likely to encounter, the
Help Desk at GeoCommunity is a great reference. Basic information
about projections, datums and georeferencing is available here.
See the Links page for a summary of digital
mapping data sources. Click the graphics below for more
information.
|
|
Images |
DOP/DOQQ
|
DRG
|
Landsat
|
NED
Relief
|
|
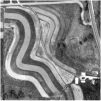
Aerial photographs
are the starting point for many mapping projects. Digital aerial
photos are called Digital Orthophotos (DOP) or Digital
Orthographic Quarter Quads (DOQQ). One of the most common
sources of free DOP data in the United States is the Microsoft
TerraServer. USAPhotoMaps
is a free utility that downloads TerraServer images for use as
base maps in other GIS software. Free digital aerial photographs
might be available through your state conservation agency, county
or other local sources. DOP and DOQQ files (which are usually
distributed on CDs due to their size) can be purchased from a
number of the vendors listed in Links.
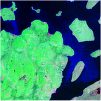
TerraServer is also
a free source for digital topographic maps (known as Digital
Raster Graphics or DRG) for use as base maps. Many
states offer free DRG data. You might also have fun experimenting
with space imagery such as the Landsat data available from
NASA, or National Elevation Data (NED) shaded relief raster
images. (See Links for sources.)
|
|
Lines,
Points and Areas
|
|
 Geographic
data described as mathematical expressions (with beginning and
ending points, length and area) is known as vector
data. It takes up a lot less file space than image (or raster)
data. Digital Line Graphs (the USGS term for vector data) for
roads, streams, land surveys, etc. can be viewed without any background
image or placed over the top of aerial photos and other images.
One of the advantages of vector format information is that it
can be resized without any loss of clarity, whereas raster (or
image) data becomes pixilated if enlarged too much. Geographic
data described as mathematical expressions (with beginning and
ending points, length and area) is known as vector
data. It takes up a lot less file space than image (or raster)
data. Digital Line Graphs (the USGS term for vector data) for
roads, streams, land surveys, etc. can be viewed without any background
image or placed over the top of aerial photos and other images.
One of the advantages of vector format information is that it
can be resized without any loss of clarity, whereas raster (or
image) data becomes pixilated if enlarged too much.
USGS
DLG data comes in large scale (1:24,000, corresponding to 7.5
minute USGS topographic maps), intermediate scale (1:100,000)
and small scale (1:2,000,000). They vary in the amount of detail
presented. See Links for sources.
 If
you want to map your own thematic information (like the forest
cover types on the left), programs in the Toolbox
can help you create vector lines, points or areas. Mapping programs
have unique vector file formats for storing object information
(like size, color, line width, etc.). Shapefiles (*.shp), for
example, are used by ESRI ArcView®
software and many other products. Other common vector types are
MIF/MID (MapInfo), DXF (AutoDesk), AI (Adobe Illustrator), etc.
Some file formats are definitely "smarter" than others,
including additional information such as geospatial locations,
the map projection used and links to databases. If
you want to map your own thematic information (like the forest
cover types on the left), programs in the Toolbox
can help you create vector lines, points or areas. Mapping programs
have unique vector file formats for storing object information
(like size, color, line width, etc.). Shapefiles (*.shp), for
example, are used by ESRI ArcView®
software and many other products. Other common vector types are
MIF/MID (MapInfo), DXF (AutoDesk), AI (Adobe Illustrator), etc.
Some file formats are definitely "smarter" than others,
including additional information such as geospatial locations,
the map projection used and links to databases.
|
|
Elevations
|
|
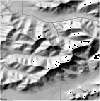
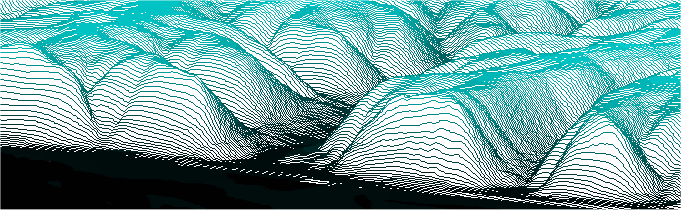
A Digital
Elevation Model (DEM) contains an array (or grid) of numbers
recording the height of ground positions at regularly spaced horizontal
intervals. The heights can be represented by a wire frame or colors
like the next two examples below. Computer software can use a
DEM to create 3D images of a landscape, applying lighting effects
that reveal hills and valleys. 2D aerial photos or satellite
images can be overlaid on a DEM to create a
"virtual reality" view.
See
the Links page for sources of free DEM
downloads.
|
|
|
|
Spatial
Databases
|
|
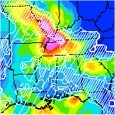 |
A Geographic
Information System (GIS) goes beyond cartography to find
answers to geospatial questions. GIS is the mechanism
for visualizing spatial data related to the Earth's surface.
For example, where do tornadoes occur most frequently?
Which habitat types have the highest deer populations?
Where are the oldest pine forests with the highest risk
of pest damage? For an example of GIS in action, visit
the National
Oceanic & Atmospheric Administration (NOAA) Internet
site. For more information about geospatial analysis,
visit
GIS.com. |
|
|
|
|
Where
to begin?
Exploration
is one the best ways to learn about the treasure of geographic
data that is available. See
the Links page for sources of digital
mapping data. For software to look at data or to make your own
maps, see the Digital Grove
Toolbox. The examples for the TatukGIS
Free Viewer show many GIS data scenarios to try.
You might also want to try some
of the on-line mapping sites like the
USGS National Map.
|
|
Top
/ About
|
|
|