|
MicroDEM
is the product of over twenty years of work by Peter Guth, Professor
of Oceanography at the US Naval Academy in Annapolis, MD. It contains
a staggering number of options and functions, to the point where
it may be overwhelming to the new user. But stick with it ...you're
almost certain to find multiple functions that are unique to it,
or that you'd have to pay quite a bit of money to duplicate with
other software. MicroDEM is 100% free.
|
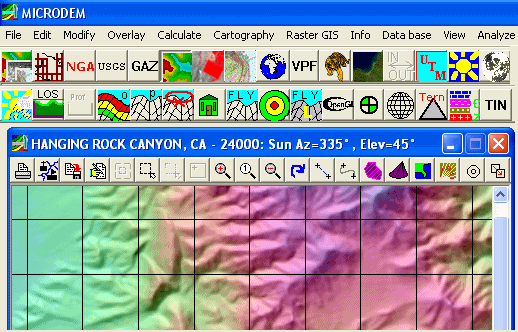
Partial Display of the
Menus and Tools in MicroDEM
|
There are
at least three versions of MicroDEM currently available:
MicroDEM
5.1: An older version from 2001, back when it was also being
supported by the US Army as "Terrabase II". Available
from Fort Leonard Wood (http://www.wood.army.mil/TVC/DefaultPageContents/MicroDEM_TBII.htm).
May work better for slower computers.
MicroDEM
6.03: The last official and fully debugged version of Terrabase
II; contains most of the functions of version 5.1, plus
many
new ones. Available at
http://www.wood.army.mil/TVC/DefaultPageContents/MicroDEM_TBII.htm
Microdem
7/8/9: Successive versions of MicroDEM have been released
as alpha software, with version 9 first appearing in September
2005. As alpha, the software does have bugs and quirks, but it
also has far more features than version 6.03. Available at
http://www.nadn.navy.mil/Users/oceano/pguth/website/microdemdown.htm.
There is a full setup file for version 9 that is updated every
few months; updated versions of the executable and help files
are released on a fairly regular basis.
Tip:
You can have different versions of the software installed on the
same computer (e.g. both version 6.03 and version 9), but it's
probably best to install the older version first so that the data
folder is updated properly for the newer version upon installation.
|

|
The Wisconsin
State Cartographers Office offers a simple tutorial
for creating perspective views with MicroDEM.
|
Documentation:
Extensive documentation exists for the older versions, most of
which is applicable to the most recent version as well. PDF
manuals
for versions 5.1 and 6.03 are available at
http://www.wood.army.mil/TVC/DefaultPageContents/MicroDEM_TBII.htm,
as are short video demonstrations of many
of the functions. Tip: Make sure you install the Camtasia Codec,
available at the site, in order to view the videos. Both versions
5.1 and 6.03 come with large help files as part of the installation.
There is no corresponding PDF manual for version 9, but the help
file is large and generally comprehensive, though newly-added
functions may take some time to be fully documented.
Professor
Guth also maintains a MicroDEM forum on Delphi (http://forums.delphiforums.com/microdem/start),
where you can post questions and bug reports.
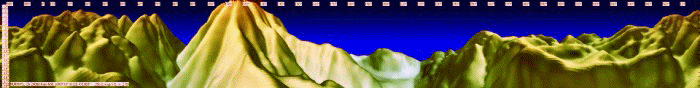
MicroDEM
Panorama
MicroDEM
Capabilities
There are simply
too many capabilities in MicroDEM to describe all of them fully.
What follows is an incomplete listing of many of its current capabilities.
The program's help file has more information. The functions listed
are those available in version 9; many, but not all, are also
available in version 6.
2-D DEM display
and analysis:
MicroDEM can
directly read in DEMs in many standard formats, and also includes
converters for other formats that it doesn't support natively.
It also writes DEMs in several different formats, including GeoTiff,
ASCII, DXF and ArcGrid. MD will re-interpolate DEMs to UTM or
geographic coordinates with the spacing of your choice.
Tip: MicroDEM will save DEMs in .DEM format, but
it's a native format that many other programs won't recognize
(one exception is Global Mapper).
Reflectance:
- Variable
sun angle and altitude
- Variable
vertical exaggeration
- Choice
of aspect-based shading or sun angle shading
- Coloration
in greys, blue/green, six colors, and IHS
- Automatic
water coloring for flat areas / sea level
- Blue/red
stereo anaglyph with user-adjustable exaggeration
Slope/cant:
Six display
variations from Display Parameters
- Standard
(with user-definable colors for slope ranges)
- Trafficability
(pre-defined colors)
- Gray-scale
- Rainbow
- Pastel
- Go/No
Go
Three display
variations from Tinted Maps
- Slope
%
- Slope
degree
- Slope
sine
Aspect (which
compass direction the slope is facing): Available in two different
forms from the Display Parameter menu and the View => Tinted
Maps => Aspect menu
Blank: Useful
when viewing or saving overlays
Additional
options from Tinted Maps include:
- Relief
- Profile
convexity
- Plan convexity
- Cross-sectional
curvature
- Minimum
curvature
- Maximum
curvature
- Openness
upwards (positive)
- Openness
downwards (negative)
- Ridges
- Summits
- Base level
Tip: If you export an image from MicroDEM, it will
be in screen resolution; to export in full resolution, make sure
you zoom the display to 1:1 using the "1" button at
the top of the map display.
Terrain categories:
Creates an overlay for a specified range of parameters, including
slope, elevation, aspect and relief. For example, you could find
all areas on DEM with slope between 20 and 45% on north-facing
slopes above 3000 feet.
Drainage basin:
Works with TARDEM to do drainage basin operations. Under this
menu item, will also plot downhill vectors on DEMs.
Contours: Calculates
and displays contour lines with user-definable spacing and colors
Elevation extremes:
Locates all points between user-specified values
Slope calculations:
- Finds slope
between two specified points
- Finds excessive
and steepest slopes on DEM
- Calculates
slope at a particular point
Intervisibility
options:
Program author
is actively working on these functions, and they may or may not
be working with any particular build of the program:
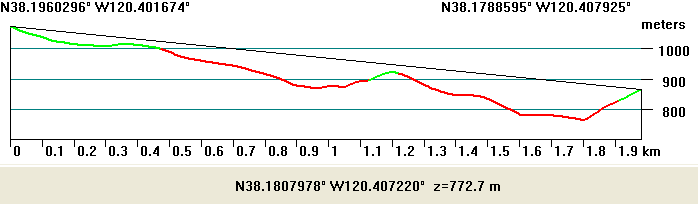
MicroDEM
Line-of-Sight (slopes in green are visible from the selected vantage
point)
- Line-Of-Sight
(LOS)
- Calculates
LOS graph between two user-specified points
- Plots
visible as green, invisible as red
- Moving
mouse cursor along graph moves corresponding cursor along
DEM display
- Calculates
parallel profiles
- Also
available for arbitrary shape as Stream Profile
- Weapons
Fan (aka Viewshed)
- Calculates
area visible from a specific point on DEM
- User-adjustable
ranges, elevations
- Plots
visible, hidden or both with user-specified colors and opacity
- Horizon
calculations
- Calculates
angle and distance of horizon blocking, plots on DEM
- Calculates
sun blocking for any day or days of year (when sun is visible
or masked by topography)
- Creates
sunlight visibility DEM maps for user-defined area for any
day/days of year (very slow)
- Route coverage
- Shows
what areas are visible as you travel along a route, as a
static map and animation
- Target coverage
- Calculates
percentage of a target area visible from a specific point
- Route observation
of target
- Shows
when a target area is visible
Cartographic
functions:
- Distance
calculation
- Straight-line
- Stream
selection (arbitrary shape)
- Area calculation
- Range circles
- Bearing
measurements
- Offset plotting
(distance and bearing from a point)
- Datum shift:
Calculates shift between Primary and Secondary datums for any
point on map.
- Magnetic
variation values: Calculates magnetic declination for any point
- UTM Grid
/ True north declination: Calculates variation between UTM grid
and true north
- Horizontal
earth curvature: Calculates true distance compensating for earth's
curvature
- SPCS: Converts
location to State Plane Coordinate System
-
Tip:
Many options leave drawing traces on DEMs and maps; to remove
many of these, use the Force
Redraw button. Overlays can be removed using the Overlay management
functions.
Satellite image
analysis:
- Automatically
loads in multi-band Landsat, Quickbird and IKONOS imagery
- User-specificable
band display (i.e choose which bands to display as Red, Green
or Blue)
- Band histograms,
scattergrams, ratios, differences
- Pre-defined
normalized differential indices NDWI, NDVI, NDSI, NBR
- Digital
filtering for sharpening, edge detection
- Satellite
image component matrix and principal component calculation
- Imagery
"training" for category classification
- Merging
of 30m color data with 15m panchromatic imagery
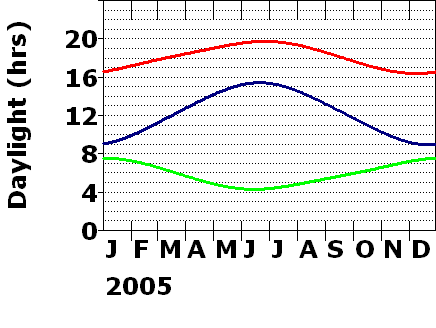
(Above) For a location double-clicked on a DEM,
the red curve shows the time for sunset; the green curve the time
for sunrise, and the blue curve the duration of daylight.
Analyze menu:
- General
coordinate converter (projection/datum)
- Sun/moon
rise/set calculator
- Magnetic
variation (both deviation and dip as function of position
and altitude)
RasterGIS menu:
- Analyze
DEM for holes
- Elevation
frequency histogram
- Antenna
heights
Database Menu:
- Allows
loading of databases (shapefile, DBF, CSV) associated with
loaded map. For shapefile DBF databases, you can plot the
features based on database variables with a variety of symbols
and colors, directly edit database entries, filter the database
using standard queries and then create a subset shapefile
of those filtered features.
Tip: While MicroDEM can handle raster files in
UTM or geographic coordinates without intervention, it requires
shapefiles and coordinate-related databases to be in geographic
coordinates (latitude/longitude). The Data Manipulation section
contains utilities to convert shapefiles from UTM to Lat/Lon and
back again.
View Menu (used
when DEM is loaded, with or without associated map):
- LOS: Calculates
elevation profile and line-of-sight visibility (green for
visible, red for not).
- Oblique:
Creates a static oblique 3D view
- OpenGL:
Creates a rotatable and modifiable 3D view
- Perspective:
Creates a 3D landscape as viewed from a particular location
(with the ability to drape photos or maps on top)
- Panorama:
Similar to perspective, but creates 360-degree view
- Hint:
If you have installed the Gazetteer data, you can use it to
label peaks in the Panorama and Perspective views
- Circle
Around: Creates an animation where you move around a point
while constantly looking in the direction of the point.
- Fly Through
/ Live Flying: Creates a fly-through animation that can be
saved as a movie. Fly Through follows a pre-determined route,
while Live Flying allows you to control the flight with keyboard
controls. VRML 3D Viewer (from toolbar): Allows creation of
3d VRML views
Right-click
options (can be used on maps, photos and DEM views):
- Grid:
Draws a UTM or lat/lon grid on map
- Load:
Allows several options, including downloading of TerraServer
map imagery for a particular location (DOQ or DRG); loading
of catalogued DEM or DRG imagery that correlates with the
currently displayed map; downloading of JPL TM imagery (432).
- Overlay:
Allows overlay of US Census TIGER data or USGS Gazetteer info
(if properly installed and indexed)
- Gazetteer:
If installed, loads in full USGS Gazetteer database 3D Map
Options: Sets parameters for 3D anaglyph display; also allows
de-collaring of USGS 24K topo quads
- Download
from USGS seamless server: Automatically creates DEM download
links that work with USGS seamless server (seamless.usgs.gov)
GPS: Interfaces
with GPS for real-time tracking, waypoint download/upload.
Data Manipulation:
A separate section with many useful functions, including:
- Import,
Export and Merging of a variety of types and formats of data
Numerous shapefile/database utilities, including projection/datum
conversions, adding field (including those from linked fields),
merging shapefiles, etc.
- See a
short tutorial on adding datum information
to a GeoTiff file with MicroDEM.
Misc.
Features:
Zip/unzip utilities
The ability
to index map data (raster, TIGER, Gazetteer) for easy data index
display and retrieval
Geo-referencing
of scanned raster files
Basic shapefile
creator and editor (points, lines and areas), but no advanced
features such as snap, drill, etc.
Map annotation
and marginalia tools, including many designed specifically for
geology and oceanography applications
Perspective
and panorama views can be produced in anaglyphic or side-by-side
stereo views.
About
|