|
4.) Add data
points to the map. You can add points one-at-a-time with the "Add"
button (in the Objects/Points menu, left) by manually double-clicking
on the map. That sets the X-Y map point, and then you provide
the data value and point name.
Another approach
for a lot of points is to use a spreadsheet program like Excel
to prepare your data. The spreadsheet columns need to be set as
X, Y, Value (Z) and Name in that order. You can
then select and copy the columns and rows in Excel, then go to
3DField and click Edit/Paste. The points will appear on the map.
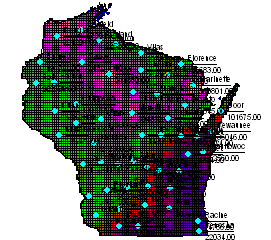
The trial version
of 3DField truncates the table at 53 rows. Since Wisconsin has
72 counties, I selected 53 representative sample points spread
around the state.
You can also
add/delete/change the points with the Objects/Points menu (left)
or import a "csv" or "dat" comma delimited
file.
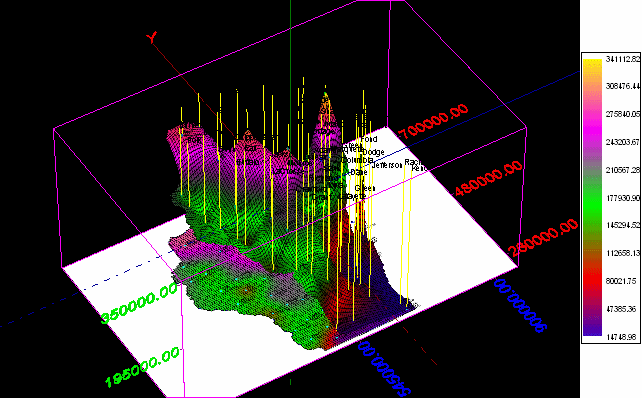
The values for
the table (the acreage of family owned forestland) were easy to
find on the US Forest Service Forest
Inventory Analysis site. I established the X and Y values
simply by moving the cursor over the counties on the map and observing
the X/Y values in the bottom status bar: .
In this example, X = 636120 and Y = 254500. .
In this example, X = 636120 and Y = 254500.
|

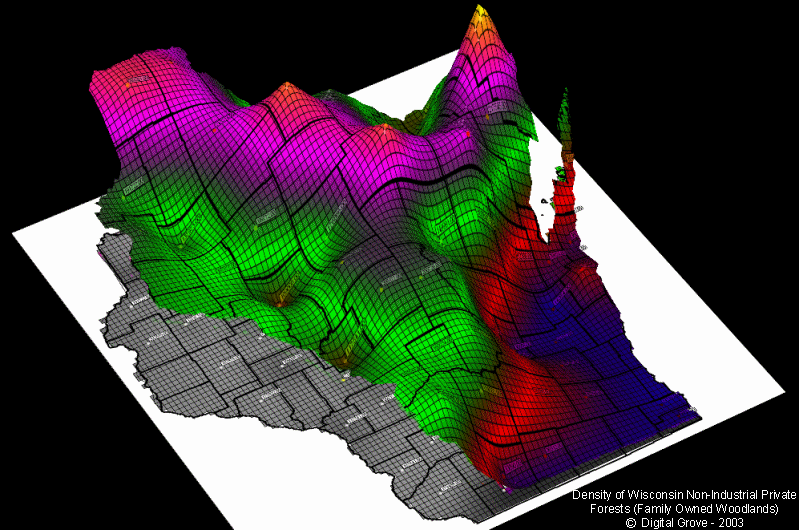
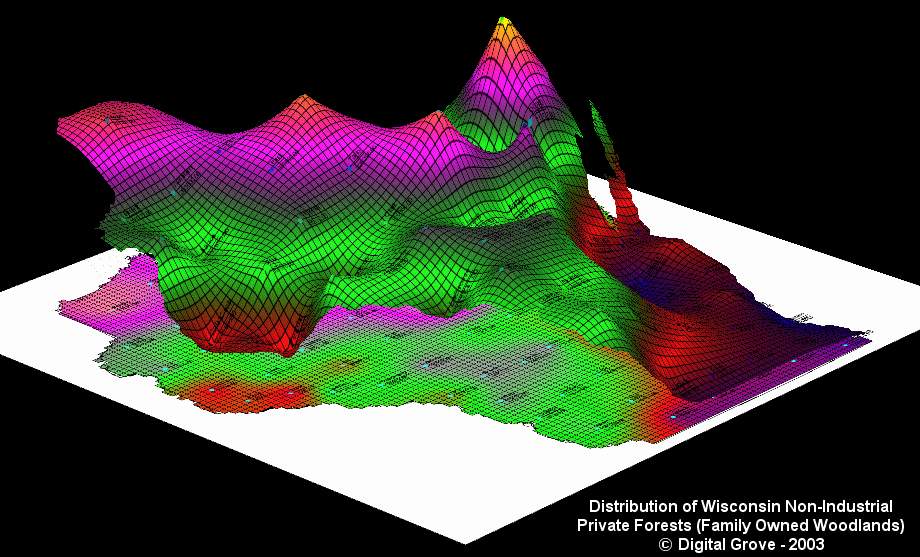
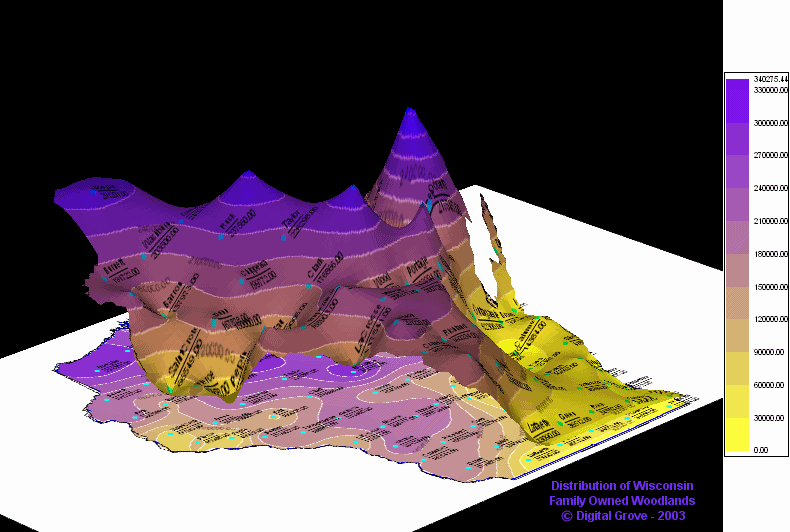
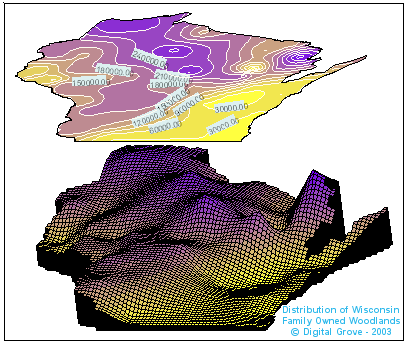
 6.)
Select one of the 3D map types from the menu bar to transform
the image. Then use the Image/Format command (left) to customize
the product.
6.)
Select one of the 3D map types from the menu bar to transform
the image. Then use the Image/Format command (left) to customize
the product.