|
|
|
|
|
Freeware
or Shareware (SW)
recommended but not sold here. Some of these tools are for specific
technical tasks. Others are fun, showcasing good programming to
explore spatial geography.
|
|
|
|
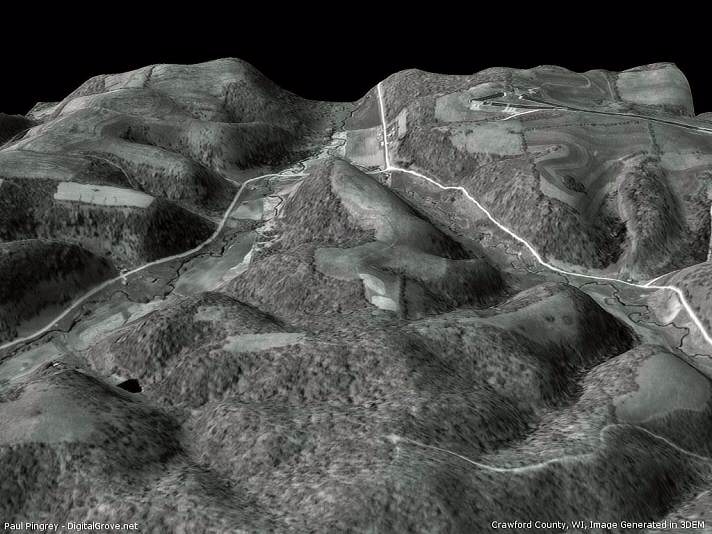
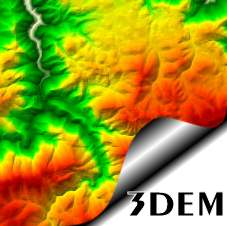 3DEM
produces three dimensional terrain scenes from 2D images ...great
for analyzing fire control, erosion, aesthetic management and
other resource issues. The program can provide high-resolution 3D
views using many elevation model sources, including new data from
the Space Shuttle Radar Topography Mission. Create animated flights
through virtual terrains of real places. Connect with Garmin or
Magellan GPS receivers to display waypoints, routes, and tracks
in 3D or generate elevation profiles of GPS tracks. 3DEM
produces three dimensional terrain scenes from 2D images ...great
for analyzing fire control, erosion, aesthetic management and
other resource issues. The program can provide high-resolution 3D
views using many elevation model sources, including new data from
the Space Shuttle Radar Topography Mission. Create animated flights
through virtual terrains of real places. Connect with Garmin or
Magellan GPS receivers to display waypoints, routes, and tracks
in 3D or generate elevation profiles of GPS tracks.
3DEM's "Save Map Image" function makes spectacular hillshade
color elevation maps for use in other GIS programs. Simply
load an elevation model, adjust the elevation colors to your liking
(F4), resize the overhead view (F7) and use "File/Save Map
Image" to export a GeoTiff image for use in spatial mapping
programs like the TatukGIS Editor or Viewer. 3DEM can also
convert the UTM datum from NAD27 to NAD83 or other ellipsoids
if desired.
Make 3D aerial photos, topographic
maps, screen captures, scanned photos, Landsat images or other
source material for 3DEM overlays. Rotate and scale terrains to
fashion the view you want. 3DEM can also be used in tandem with
overlays from other programs like the TatukGIS Viewer for perspective
views that include images with vector layers.
3DEM
is a product of Visualization
Software LLC by Richard Horne. See the
3DEM Gallery for more examples. Click here
or the image above to download 3DEM version 19.0.
|
|
|
|
 USAPhotoMaps
retrieves and displays TerraServer aerial photos, urban
photos, topographic maps, elevation data, place names, TIGER (US
Census) roads, road names and USGS landmarks. It is one of the
fastest tools available for navigating to any location in the
United States and collecting TerraServer image tiles for base
maps. Assemble images into single, georeferenced base maps that
can be opened by geospatial programs or drawing programs. Use
USAPhotoMaps to quickly get latitude, longitude or UTM coordinates
for any position. GPS waypoints, routes and tracks can be displayed
as map overlays and transferred to or from GPS units. USAPhotoMaps
retrieves and displays TerraServer aerial photos, urban
photos, topographic maps, elevation data, place names, TIGER (US
Census) roads, road names and USGS landmarks. It is one of the
fastest tools available for navigating to any location in the
United States and collecting TerraServer image tiles for base
maps. Assemble images into single, georeferenced base maps that
can be opened by geospatial programs or drawing programs. Use
USAPhotoMaps to quickly get latitude, longitude or UTM coordinates
for any position. GPS waypoints, routes and tracks can be displayed
as map overlays and transferred to or from GPS units.
USAPhotoMaps is available for free download from JDMCox
Software.
Forest Pal offers instructions
for using USAPhotoMaps here.
|
|
|
Quantum
GIS
 Quantum
GIS (QGIS) is an up and coming, open-source Geographic Information
System that runs on Windows, MacOSX, Linux and other operating
systems. It offers support for common vector and raster formats,
including spatially enabled tables in PostgreSQL using PostGIS.
Plug-ins are available to add functionality, including one to
interact with GRASS (a complex and difficult GIS). QGIS is not
as advanced as commercial applications like the free TatukGIS
Viewer or the TatukGIS Editor,
but it has a simple interface and offers an introduction to GIS
techniques. Quantum
GIS (QGIS) is an up and coming, open-source Geographic Information
System that runs on Windows, MacOSX, Linux and other operating
systems. It offers support for common vector and raster formats,
including spatially enabled tables in PostgreSQL using PostGIS.
Plug-ins are available to add functionality, including one to
interact with GRASS (a complex and difficult GIS). QGIS is not
as advanced as commercial applications like the free TatukGIS
Viewer or the TatukGIS Editor,
but it has a simple interface and offers an introduction to GIS
techniques.
|
|
|
MARPLOT
is designed for viewing and making maps derived from US Census
TIGER® line data. Both the MARPLOT
program and the TIGER
basemaps are available for free download. The program and
data are produced by the US Census Bureau, US Environmental Protection
Agency and National Oceanic and Atmospheric Administration.
The TIGER derived basemaps have
predefined display properties making them easy to load and navigate.
MARPLOT also features a utility to import ESRI® shapefiles in
UTM, Geographic (lat/lon) and Albers projections. A layer control
center allows you to determine at what scale features or their
labels and symbols appear in the map. User layers can be created
for new point, line and area objects. Objects' lengths and areas/perimeters
are automatically saved. Typical line, polygon and text drawing
tools are included, but more advanced features such as snap or
COGO functions are not.
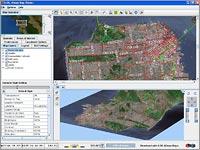
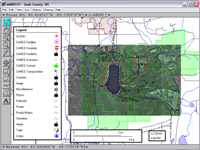 Aerial
photographs and other scanned images can be used as basemaps in
MARPLOT. The program offers two methods to geo-reference images.
The first involves providing the latitude and longitude for two
points on the image. The second allows users to dynamically drag
and stretch an image until it corresponds with loaded vector data.
Very nice! (Click the image on the left for a screenshot.) Aerial
photographs and other scanned images can be used as basemaps in
MARPLOT. The program offers two methods to geo-reference images.
The first involves providing the latitude and longitude for two
points on the image. The second allows users to dynamically drag
and stretch an image until it corresponds with loaded vector data.
Very nice! (Click the image on the left for a screenshot.)
You can print maps made in MARPLOT
or export image or vector (enhanced metafile) files. The exported
files are not, however, georeferenced for use in other GIS programs.
MARPLOT is part of a suite of programs
developed by the US Census Bureau and EPA for accessing demographic
data and planning environmental protection programs. If you enjoy
scientific inquiry, MARPLOT and the companion programs,
LandView 5 and CAMEO
are definitely a class act.
Download the free MARPLOT Program (for PC or Macintosh computers)
here.
Specially
formatted, TIGER® Line derived US basemaps for MARPLOT are available
for download here.
|
|
|
 Ever
dream of flying effortlessly around the Earth through mountain
valleys and over farmlands, deserts or cities? If you are fortunate
to have a robust PC (1 GHz P3 or better) with a good
3D video card and cable Internet connection, you can experience
something similar. NASA's World Wind amazes not only with seamless
integration of elevation data, satellite imagery and a vast collection
of remote sensing data but most dramatically with its motion.
Still
images cannot fully convey the feeling of World Wind. Ever
dream of flying effortlessly around the Earth through mountain
valleys and over farmlands, deserts or cities? If you are fortunate
to have a robust PC (1 GHz P3 or better) with a good
3D video card and cable Internet connection, you can experience
something similar. NASA's World Wind amazes not only with seamless
integration of elevation data, satellite imagery and a vast collection
of remote sensing data but most dramatically with its motion.
Still
images cannot fully convey the feeling of World Wind.
The World Wind download
can be a challenge at 53 MB (don't even try if you are on dial-up).
Once installed including a special Direct X Managed Code component,
operation is straightforward with mouse
or keyboard commands. Data is acquired on demand based on
the layers you specify and cached on your PC for future use. More
information and the free program are available from NASA.
See the
World Wind Central Wiki for current developments, plug-ins
and more.
|
|
|
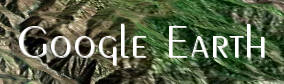 Not
to be outdone, Google has its own 3D Earth viewer, Google Earth.
And beautiful it is. DigitalGlobe®, other recent color imagery
and even 3D buildings are combined in a fly-anywhere virtual world.
You can selectively turn on infrastructure layers including roads,
stores, schools, etc. Like World Wind, Google Earth will only
run on relatively new PCs with good video and broadband Internet.
The free version is cool (about a 10 MB download), but for $20
(annual subscription) you can get a plus upgrade that allows you
to add your own data or annotations, and it offers higher image
resolution. Not
to be outdone, Google has its own 3D Earth viewer, Google Earth.
And beautiful it is. DigitalGlobe®, other recent color imagery
and even 3D buildings are combined in a fly-anywhere virtual world.
You can selectively turn on infrastructure layers including roads,
stores, schools, etc. Like World Wind, Google Earth will only
run on relatively new PCs with good video and broadband Internet.
The free version is cool (about a 10 MB download), but for $20
(annual subscription) you can get a plus upgrade that allows you
to add your own data or annotations, and it offers higher image
resolution.
Also, if you haven't
discovered that Google has added color 2-meter resolution color
aerial imagery to its regular maps, take a look at
Google Satellite Maps. US coverage is selective, but very
nice if your area of interest is included.
|
|
|
|
 HyperCube,
freeware produced by the US Army Corps of Engineers
- Topographic Engineering Center, prepares multi and
hyper-spectral imagery for interpretation and classification
of real world features. The small program (about 700KB
download) includes a host of functions to analyze, filter,
warp, mosaic, reformat, calibrate, and combine images.
It comes as a single "exe" file, which does
not require installation. Just unzip the file and use
it. The program is available for Windows®
and MacOSX®. HyperCube,
freeware produced by the US Army Corps of Engineers
- Topographic Engineering Center, prepares multi and
hyper-spectral imagery for interpretation and classification
of real world features. The small program (about 700KB
download) includes a host of functions to analyze, filter,
warp, mosaic, reformat, calibrate, and combine images.
It comes as a single "exe" file, which does
not require installation. Just unzip the file and use
it. The program is available for Windows®
and MacOSX®.
HyperCube
works with RAW, JPEG, TIFF, TARGA, LAN, Library, Multiband,
NITF, and SRF file formats. Mac users can also access
PICT format images. One idiosyncrasy of the File ->
Open process is that the browser shows all file types
(*.*), but the user must specify the file type to open
from a drop-down list.
HyperCube
is a handy utility to
use with the TatukGIS Free Viewer or Editor to rubber-sheet
and georeference images. Its many other uses are
well documented in a 163 page PDF user guide available
from the
Topographic Engineering Center, which also offers
sample data sets.
|
|
|
|
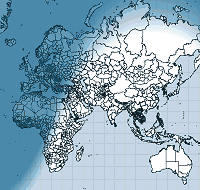 If
you'd like a virtual globe to quickly grab latitude/longitude
values, try the free TGlobe
Map Builder Application. TGlobe mainly produces GIS programming
components, but among it's offerings is the Map Builder Application
used to demonstrate the code. It loads geographic shapefiles and
images and can display the data on an Earth sphere or in Cartesian
and Mercator projections. You can also turn on a view that tracks
day/night regions. The TGlobe download page has a few data selections
for North America and Europe that are free, or you can get a world
political boundary layer (shown on the left) here
(5 MB Zip). Unzip the layer to the TGlobe folder and import
it to view. The Map Builder is a single executable file. It does
not have a formal installation routine. If
you'd like a virtual globe to quickly grab latitude/longitude
values, try the free TGlobe
Map Builder Application. TGlobe mainly produces GIS programming
components, but among it's offerings is the Map Builder Application
used to demonstrate the code. It loads geographic shapefiles and
images and can display the data on an Earth sphere or in Cartesian
and Mercator projections. You can also turn on a view that tracks
day/night regions. The TGlobe download page has a few data selections
for North America and Europe that are free, or you can get a world
political boundary layer (shown on the left) here
(5 MB Zip). Unzip the layer to the TGlobe folder and import
it to view. The Map Builder is a single executable file. It does
not have a formal installation routine.
|
|
|
Natural
Resources Database (NRDB) bridges tabular statistics
with spatial data (points, lines and areas) to create thematic
maps. As an example, the NRDB tutorial illustration to the
left shows the annual rainfall of municipalities in a province
as different colors. Use NRDB to:
-
Design and store databases for either spatial or non-spatial
information
-
Import records from Excel, Access and other ODBC compliant
formats and associate them with spatial data
-
Utilize map objects made with other mapping and GIS
programs, downloaded from the Internet, or created with
an included digitizing utility (which geo-references
scanned or downloaded maps and aerial photos that you
can trace over to make shapefiles)
-
Produce reports and graphs from database queries or
generate thematic maps from records linked to spatial
data
|
|
 Richard
D. Alexander, of the U.K., originally produced NRDB for
the Philippine Province of Bohol and now offers the free
program to encourage sustainable management of resources
around the world. His vision for NRDB, FAQs and other useful
information are available at the NRDB
User Group. Richard
D. Alexander, of the U.K., originally produced NRDB for
the Philippine Province of Bohol and now offers the free
program to encourage sustainable management of resources
around the world. His vision for NRDB, FAQs and other useful
information are available at the NRDB
User Group.
|
|
|
|

The
free DIVA-GIS software is designed to plot point data and perform
statistical analysis of spatial data distributions. The program
converts tabular data into point shapefiles and plots them with
other GIS layers. ESRI® shapefile, grid, TIFF, JPEG and Lizardtech®
MrSID file types are supported.
Additional
features offered by DIVA-GIS
include:
-
Grid manipulation
(calculator, aggregate, neighborhoods)
-
Conversion
of lat/lon data to other projections
-
Export/import
of grid and shapefile data
-
Statistical
analysis tools such as histograms and scattergrams to highlight
data correlation
-
Multiple
regression with grids
-
Display
of satellite images or digital orthophotos as basemaps
-
Geo-positioning
of unreferenced basemap images
-
GPS data
import (as points, lines, or polygons)
-
Climate
envelope modeling
-
Prediction
of crop adaptation (Ecocrop)
-
...and more
To
download the program, data and tutorials, visit the DIVA-GIS
web page.
|
Note to Birders:
DIVA-GIS could be easily adapted to mapping bird observation
lists. If you are interested in a mapping program dedicated
to birding observations, also check out Map
List by Flying Emu Software. The free demo of Map
List is useful, displaying bird distribution and
abundance information on either North America or World
maps.
|
|
|
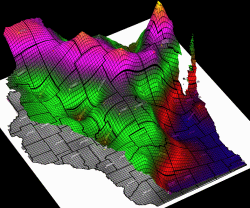 |
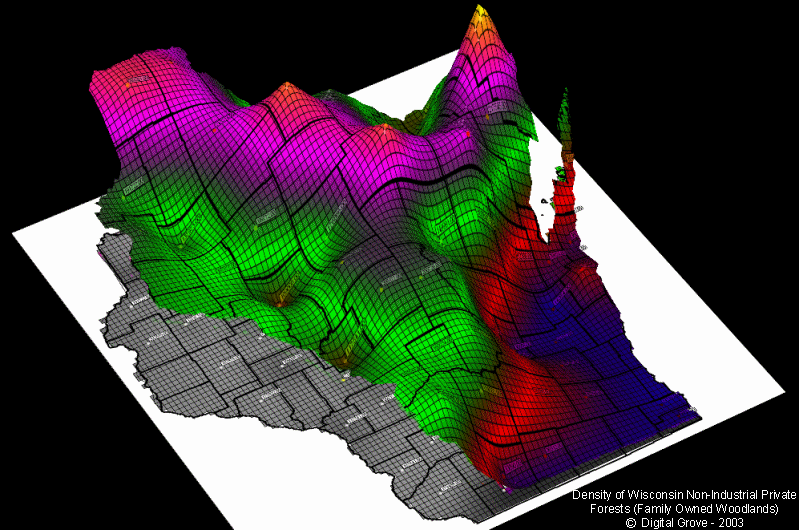
3DField
is a contouring, surface plotting and 3D data program. All facets
of 2D or 3D maps can be customized to produce stunning depictions
of your data. Click the image on the left, showing a 3D
distribution of family-owned woodlands in Wisconsin, for a full-screen
example.
The
developer provides a free, fully-functional demo that is limited
to 50 data points (enough to help you experiment and appreciate
the power of the program). 3DField provides eleven 2D and 3D map
templates that can be precisely tailored, scaled and rotated for
incredible views. Click
here
for step-by-step procedures used in the project on the left, made
with the free trial.
3DField
is the product of 15 years of refinement by Vladimir Galouchko,
the Russian developer. See the
3DField web site for complete details.
|
|
 |
SurGe
grids and maps data, calculates volumetric surfaces and completes
other sophisticated data analysis. The developer, Miroslav Dressler,
is a hydrologic engineer in the Czech Republic. The software is
fully functional at no cost, with an invitation to register for
a small fee. Download
the program for free.
Surge produces three basic types
of maps: color contours (left), isolines, and 3D maps. Click the
image on the left for additional examples. The program offers
numerous data interpolation and smoothing routines and includes
detailed documentation that explains the mathematical principles
involved.
Data is input with simple ASCII
text files that define the x-y position of each point, z (the
data value) and a label field. Used in tandem with other free
software (such as fGIS), one can easily generate text files for
the creation of boundaries (like the outline of Wisconsin) or
the position of data points. For a tutorial,
click here.
|
|
|
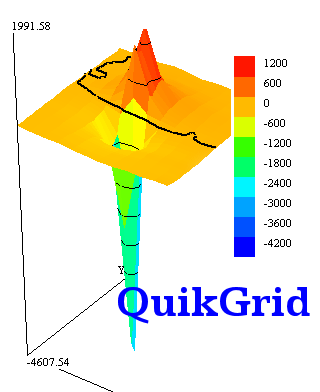
QuikGrid
can read in scattered data points (x, y, z text) representing
a surface, 1-degree USGS DEMs*, and ER Mapper raster files. The
program will generate a grid from data and display the surface
as a contour map, or as a 3d representation. The grid may be displayed
as a wire frame or as a hidden surface grid, optionally with colours.
The grid and contour lines may be output as a DXF file. The generated
grid may be output to a file as a series of XYZ triplets, in the
DXF 3DFACE format or as an ER Mapper Raster Dataset.
QuikGrid is documented
through its help facility. The left mouse button may be used to
zoom in and pan about the display. The right mouse button may
be used to display information about the generated grid coordinates
and data points. The Shift and Ctrl keys used with the arrow keypad
will spin or reorient the view.
In addition to being
incredibly fast, QuikGrid is easy to use. It will run on modest
hardware platforms. The free software is available from Perspective
Edge.
*USGS
1-degree DEMs (also known as 1:250K DEMs) are available by
US state here.
|
|
Other
Utilities
|
|

|
|
GIS and illustration programs can
take advantage of mapping
symbol fonts (like those above) that are freely available on
the Internet. One of the advantages of trying free viewers from
professional GIS companies (like ESRI, ERDAS, MapInfo, MapTech,
etc.) is that they install many of their symbol fonts into your
Windows font folder, giving you the opportunity to explore them.
 Numberpile
is an example of a free font that is useful for labeling features
on maps. Numberpile
is an example of a free font that is useful for labeling features
on maps.
|
|
|
|
 AutoREALM
is a map illustration program. It does not use real world
coordinates and cannot measure areas. AutoRealm can load raster
images (like aerial photos from TerraServer, USGS topo maps or
screen captures from Global Mapper) as backgrounds over which
you can trace features, add symbols or write text. AutoREALM
is a map illustration program. It does not use real world
coordinates and cannot measure areas. AutoRealm can load raster
images (like aerial photos from TerraServer, USGS topo maps or
screen captures from Global Mapper) as backgrounds over which
you can trace features, add symbols or write text.
AutoRealm
can create maps for role-playing games and so has some unusual
symbol libraries. You can make maps that appear to come straight
from Tolkien's Hobbit or more formal, technical map drawings.
The choice is yours. Depending on the purpose, stylized maps can
be informative and interesting.
|
|
|
 TatukGIS®
offers a free
Datums & Projections Coordinate Calculator. It converts
geographic coordinates of a point from one system to another, supporting
24 of the most common projections and 225 datums. See Joe and Jack's
Gpsinformation.net for instructions. TatukGIS®
offers a free
Datums & Projections Coordinate Calculator. It converts
geographic coordinates of a point from one system to another, supporting
24 of the most common projections and 225 datums. See Joe and Jack's
Gpsinformation.net for instructions.
Reprojecting entire files of vector
or image data is most easily accomplished with commercial tools
like Global Mapper or the coming
version of the TatukGIS Editor.
Advanced users who are comfortable with command line instructions
could check out
Shapetrans for converting shapefiles or FWTools
for converting imagery between coordinate systems. A
batch file procedure developed for reprojecting raster images with GDALWARP is available, too.
|
|
|
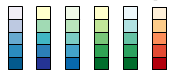 |
Need help selecting
a color scheme for a map? Try the on-line Color
Brewer from Penn State's Geography Professor Cynthia
Brewer. The application explains the merits of sequential,
diverging and qualitative legend types. You can select from
a variety pre-formulated color schemes and then see them applied
on a sample map. You can then save the color values for use
in mapping or illustration programs. |
|
|
|
 |
MapDraw
(376 KB) plots property boundaries from metes and bounds descriptions
found in deeds. It's a lot easier than pulling out a protractor,
ruler and calculator to draw out a tract. The program handles
curves, automatic closures, acreage and perimeter calculations,
print scaling, multiple lots, imperial or metric measurements,
etc. MapDraw 2.7 is shareware providing both azimuth (360°) and
bearing versions. The program will save a BMP image of the plot,
but it is not geo-referenced. (See a simple geo-referencing technique
here.)
Informatik,
Inc. also offers a newer time-limited trial, now called Mapdraw
Deed Plotter 6.2 (2.3MB).
|
|
|
|
 Freeware
database editors are available to create or edit GIS data or to
simply view data in a shapefile DBF. Freeware
database editors are available to create or edit GIS data or to
simply view data in a shapefile DBF.
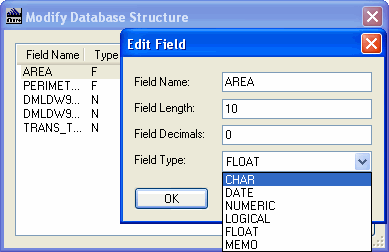
DBF Explorer is a tiny, barebones DBF III editor. It allows
basic viewing of DBF files, and the ability to add, delete and
edit records, identify field types (shown on left), plus
the ability to add attributes. MyDBF3
is a small database program that can handle DBase IV files. FEATURES:
Form designer, HTML template based reports, integral syntax highlighted
HTML editor, zoomable print preview, integral HTML 3.2 viewer,
table designer, smart filter, mail merge. Jans
Freeware, which offers MyDBF3, also has other useful programs
including CommaWorks (a program for manipulating csv data files),
SoftPlanner (a project manager) and many graphics tools.
OpenOffice.org
is a complete office suite with word processor, spreadsheet, database,
presentation, and drawing components, mostly compatible with the
Microsoft equivalents like Word®,
Excel®,
Access®
and PowerPoint®.
OpenOffice
is able to read DBF files into a spreadsheet format, and then
write them back as DBF, allowing you to make edits that are more
difficult to accomplish in some database programs.
|
|
|
|
 A
good screen capture program to save either an window, object or
freehand area can be handy for many applications, including making
maps. A couple freeware favorites include the FastStone
Image Capture and Gadwin
PrintScreen. In regard to commercial screen capture programs,
SnagIt is certainly one of the best. If you are looking for
a free image editor, check the listing at
SnapFiles. A
good screen capture program to save either an window, object or
freehand area can be handy for many applications, including making
maps. A couple freeware favorites include the FastStone
Image Capture and Gadwin
PrintScreen. In regard to commercial screen capture programs,
SnagIt is certainly one of the best. If you are looking for
a free image editor, check the listing at
SnapFiles.
|
|
 ILOG
JViews Map Viewer
is a FREE viewer for ESRI shape files, TIGER/Line 2004 data, MapInfo
Mif/Mid, VMAP data sets, GTOPO30-DEM, DTED, GeoTIFF, ASRP, URSP,
CADRG, and georeferencing of files such as JPG, GIF, TIF and PNG. ILOG
JViews Map Viewer
is a FREE viewer for ESRI shape files, TIGER/Line 2004 data, MapInfo
Mif/Mid, VMAP data sets, GTOPO30-DEM, DTED, GeoTIFF, ASRP, URSP,
CADRG, and georeferencing of files such as JPG, GIF, TIF and PNG.
ILOG
JViews Map Viewer is a pure-Java demo application that runs on
any platform that supports Java: Windows, Linux, Mac, UNIX –
you name it. Its
functionality includes thematic map creation and openGL-accelerated
3D terrain visualization.
ILOG
JViews Map Viewer: Your easy FREE way to quickly evaluate ILOG
JViews Maps’ component libraries. Download it at http://mapviewer.ilog.com.
ILOG
is a new addition to the site (Feb 1, 2007) No review or product
testing done by ForestPal at this time. If you have a review please
email it to forestpal@gmail.com
|
|
About
|
|
|
