|
Layer
Properties
The
Properties menu in fGIS is accessed by double-clicking
a layer name in the map legend/table of contents. (Note: You must
exit the Edit mode before you can access the Properties dialog
for a layer.)
fGIS
and the freeware TatukGIS Viewer (both built with the TatukGIS
DK) share similar property adjustment features. You are encouraged
to read the TatukGIS
Viewer Help PDF for additional information and examples
about map properties. You might even want to experiment with fGIS
project files in the TatukGIS Viewer, which offers a few different
features. You
can download a free copy of the viewer here.
|
|
The first option you are likely to need from the Layer
tab is Transparency. If you are adjusting the properties
of an area object, reduce the transparency if you want
to see through the object to layers below. You can also
set the Area Fill Pattern (below)
to transparent if you want the object's outline to show
with no internal fill.
Minimum/Maximum scale sets the zoom levels at which
layers display. The visibility checkbox lets you turn
off a layer without deleting the layer from the table
of contents.
In
this example, layer objects will become visible when
the scale is 1:15840 or larger and the area of the object
is greater than 5 acres.
|
|
|
The Render tab is used for creating thematic maps (different
colors, line width, labels, area fills, etc.) based
on values of data associated with vector objects. See
the TatukGIS
Viewer Help PDF for details.
|
|
|
The center tab will be
named "Area" for area objects, "Line"
for line objects, or "Marker" for point objects.
The sub-option tabs are used to set the basic color,
line width, symbol or fill of a vector object.
If you wish to see through an area object, set the
pattern to transparent. You can also set partial
transparency through the Layer tab.
Click the lower check box for the object's theme to
appear in the map legend under the layer name.
There
are a couple ways to add symbols to your maps.

One
is to create a point layer, locate points on the map,
and then designate a symbol font or bitmap for the points
through the fGIS Properties menu (left).
The
other is to export an image of your fGIS map to a document,
paint or illustration program where you can also add
legends and annotations. (The draw function in Microsoft
Word® is useful for annotating maps. Zoner
Draw 3 and AutoRealm are a couple free drawing programs
to consider.)
|
|
|
The Label tab offers many options for the appearance
and location of text labels. Select a field (taken from
an objects attributes table) to use for a label from
the drop-down box.
Labels can have more than attribute listed and be more
than one row high. The following text string in "Field",
for example, will list the Stand Number, Primary Timber
Type, and (on row 2) the Secondary Timber Type:
:#<:STAND>,
<:PRIM_TYPE>\n<:SEC_TYPE>

The text inside the brackets (e.g., <:STAND>)
are attribute names from the object's data dictionary.
See the TatukGIS
Viewer Help PDF for additional details.
|
|
|
The Chart
tab can be used to create a pie or bar chart symbols based
on an object's attributes. See the TatukGIS
Viewer Help PDF for details (about 1.4 MB ―
requires a live Internet connection). |
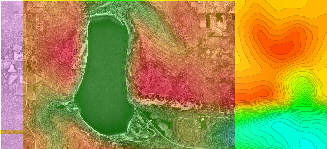
If
you have two raster images that you'd like to blend, for example,
load them both as layers in fGIS and set the top image transparency,
contrast, etc. with the Properties tool. Here's an example of
a grayscale aerial photo on the left, blended with a color elevation
map (from 3DEM, with red/orange being the highest elevations)
on the right. This combination was achieved with the raster
layer/pixel settings shown below.
 |
As
with the Layer tab for vector objects, you can set the minimum/maximum
scale at which an object will be displayed. You'll need
to experiment with the Transparency and Addition values
to get the best appearance.
|
 |
The
Pixel tab provides more raster adjustments as shown, allowing
fine adjustment of raster images.
|
-
Comments
can be added to the Layer Properties dialog and saved with
the project or to the layer.ini file. (Layer Properties
dialog > Layer tab > Info section).
-
For
additional examples of layer.ini files, see the "ini"
directory in the fGIS program folder. It includes "ini"
properties for use in Wisconsin DNR Managed Forest Law (MFL)
maps. Standard point, line and polygon display properties
used for MFL maps can be loaded by making a layer active and
using the function "Layer=>Load .ini".
|