|
|
|

|
|
Tools


-
Save 
Saves the
current project and view. To save the project with a different
name (leaving the original intact), use "Save As"
from the Map Menu.
-
Print
Simple Map 
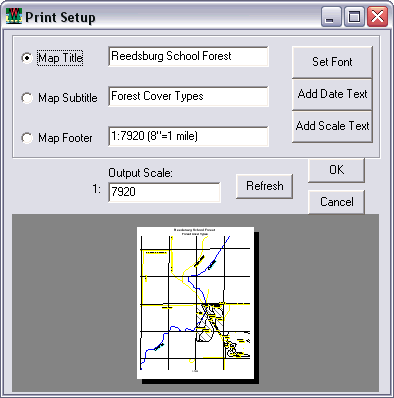
After clicking
Print/OK, fGIS will prompt you for a map title, subtitle
and footer to print on the page. You can also specify the
scale at which to print and select the fonts used in the map
titles and footer. If you wish to print at a scale of eight
inches per mile, designate a scale of 1:7920. A print preview
is provided.
Hint: Prior
to using "Print Simple Map", use the Center Tool
to choose a specific point for the map center. That way, if
you make subsequent map adjustments, you can repeat the print
job with similar boundaries.
Note: Some
printer drivers have been found to misalign image and vector
layers when map titles/footers are included in a simple print
job. If that happens, leave the fields blank.
fGIS offers
three additional print options:
-
The
Send Map to Word command (available through the
Map>Print sub-menu) will send an image of the view
at a user specified resolution and scale to Microsoft®
Word. The
user is given options to add the map to an existing document
(browse to the document) or to create a new document.
A Wisconsin DNR MFL Map Header document file is included
in the fGIS folder to use if needed. The "Crop"
image tool in Word creates a mask around the image without
changing the scale or distorting the image. The
"Crop" tool is available on the Picture toolbar
in Word. (Use View>Toolbars in Word to turn on the
Picture toolbar. Apply the Crop tool to the handles in
the middle of the picture edges for best results. You
might need to move the image back and forth to access
the edges.) Also, fGIS adds the map scale (e.g. 1:7920)
as text in Word for the user's reference. The Send Map
to Word command has been tested on Word 97, 2002 and 2003
with satisfactory results.
-
A
new dialog
includes the previous Simple Map as well as a Template
Map printing section, page orientation, and printer setup
functions. A template example is included (print.tpl)
for advanced users who want to design their own. The template
files can be edited in Notepad. (Wisconsin DNR foresters
will receive additional print template files from the
GIS specialist.)
-
A
fourth option through the Export Image tool will
send the map to a technical illustration/page layout module
called Diagram Designer.
You can add headers, legends, annotations and non-spatial
symbols from template palettes in the Diagram Designer
module.
-
Layer Add/Delete

Add or delete
layers to the table of contents with these buttons. When you
click the Add Layer button (+), a file browser opens. Navigate
to to the folder where the data files are located. fGIS will
list the files it is capable of opening. You can select more
than on file at a time by holding down the Shift or Ctrl keys
when you click on file names. The Delete Layer button (-) drops
the layer from the table of contents (but does not change the
files located on your hard drive).
The Add/Delete
Layer functions do not work if you are in the Edit mode. (Stop
editing first.)
-
Zoom and
Position 
fGIS provides
a number of tools to change the view.
-
The first, with a globe,
will zoom to the full extent of all loaded layers. (If
you want to zoom to the extent of a particular layer,
use "Layer/Zoom to Layer" from the menu bar.
-
The next two (- and +) zoom
out or in with incremental steps.
-
The open magnifier is a
freeform zoom. Drag a box down and right to zoom in. Drag
a box up and left to zoom out.
-
The Pan Tool (hand) is used
to drag the view to a new position with the mouse.
-
The circle tool will re-center
the view on any point that you left-click.
-
The Prior Extent
tool will take you back to a previous view. Only
the previous 10 extents are available. The Prior Extent
history is created by the Zoom, Pan and Re-center tools
(not from the bottom or right-side slider controls).
-
Attribute

The Attribute
Tool will display the attribute information (data dictionary)
of any object you click in the view. The object will first
flash red and yellow, then an attribute table will open. If
the object is in the active layer, and if the Edit mode is
on, the attribates for the selected object may be changed.
|
Note:
If you are using the Attribute Tool, but are unable
to "hit" the object you want, move the
target layer containing the object to a higher position
in the layers list. Each area layer is somewhat
like a pane of glass. You can't hit an object in
a lower pane if an object in a higher pane is in
the way.
|
If you
are in the Edit mode (right-click the view and click "Start
Editing"), you can use the Attribute Tool to change the
data values associated with an object. After clicking on an
object, a table with two columns similar to the following (with
a data dictionary specific to the object) will open:
Right-click
in the left column to change a field label or to add/delete
a field. You can also add a new field by right-clicking below
the last row. Left-click in the right column change an attribute
value. Click OK when finished to save your changes.
-
Pick

The Pick
Tool allows users to select shapes from the active layer in
the legend. Selected shapes are highlighted in red. Multiple
shapes can be selected by holding down the CTRL key. Selected
shapes can be merged with the Union Selected Shapes command
in the Edit menu.
-
Measure

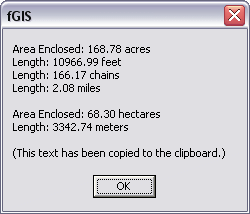
Click points
to forma a line or shape. Double-click to view the measurements.
Measurements are reported in acres, feet, chains (1 chain
= 66 feet) and statute miles.
|
Note:
fGIS will produce measurements
only for data that is meter-based or feet-based.
If you use data with Geographic coordinates (lat/lon
coordinates, which are decimal-degree based), fGIS
will not generate areas or distances with the measure
tool or other shapefile creation or editing functions.
|
-
Export
Image 
Drag a
bounding box to export a geo-referenced image of any portion
of the screen view. The Export Image Tool can be used, for
example, to clip out an image of just one survey section.
After dragging
the bounding box, the following resolution output dialog will
open.
The default
resolution of 1 will save the image at the screen resolution
(which might result in a coarse picture when printed). Increasing
the resolution will result in a larger file that may print
better, depending on the results you are seeking. (A resolution
of 2 is usually optimal for Wisconsin MFL maps, provided you
zoom in to fill the view with the PLSS section first.)
Images
can be saved in TIF, PNG, BMP and JPG formats (with the associated
world coordinate files). The PNG format is especially useful
for maps that do not include raster images like aerial photos,
keeping the file size relatively small.
When you
use the Export Image Tool, an option will appear to open the
image in Diagram Designer, a page layout module. You can learn
more about using Diagram Designer here.
[Note:
If an image fails to open in Diagram Designer on the first try,
repeat the image export a second time using the same file name
as in the first go. The image will open in Diagram Designer
on the second try. This is a known bug in fGIS, which will be
corrected. Also, exported images must be saved in a PNG, BMP
or JPG format if they are to be used in the Diagram Designer
module.]
-
Split
Shape 
The Split Shape Tool (a tomahawk symbol) divides
a polygon or a line into smaller units by drawing a line through
it. The Split Shapes Tool updates the area and perimeter/length
of each subunit when a polygon or line is divided.
Splitting a Polygon with a Line
(Double-click to complete the
procedure.)
One
of the easiest methods to digitize forest cover types (or
any other land cover polygons) is to first outline an entire
parcel, and then use the splitter tool to subdivide the whole
into its parts.
Occasionally,
you might encounter a polygon that displays a warning that
the shape cannot be split when you try to subdivide it. That
is caused by some irregularity in the structure of the object's
data. If that happens, use the Edit Points Tool to slightly
adjust the object, and then try the Split Shapes Tool again.
|
Warning!
A precaution to keep in mind with the Split
Shapes Tool: Do not try to follow the boundary of
a shape. Since the Split Shapes Tool does not snap
to other objects, trying to follow another boundary
will result in "orphans" (polygon slivers
that you'll need to delete and clean up later).
Plan your technique so as to cleanly divide polygons,
using more than one split if needed.
|
Hint:
The line object splitter function is useful for cleaning up
GPS tracks imported through the DNR Garmin Tool or other GPS
programs. It can be used to snip out extraneous GPS track
segments.
-
Edit
Points/Select Tool 
Select
the layer containing objects that you want to edit, then right
click the view and choose "Start Editing". Click
the Edit Points Tool, and then left-click the object you want
to change (or select). Click near the center of the object
to avoid changing a vertex on the first click. Move nodes
or insert vertices with the Edit Points Tool.
You
can also use the Edit Points/Select Tool to delete a shape
by first selecting it and then hitting "delete"
on your keyboard.
Additional
Polygon Functions that can be
used with the Edit Points/Select Tool are listed below.
|
Note: It's often
easiest to digitize a complex shape by first enclosing
it in a simple polygon. Then, use the Edit Points
Tool to pull the shape to conform with the object
being digitized.
|
-
New
Shape 
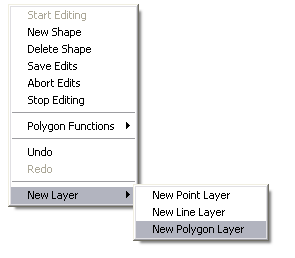
When
you are in the Edit mode, click the New Shape Tool to insert
another object in the active layer. To create a new
shape layer, right-click the view and select the appropriate
shape category from the menu that opens:
You'll
be given options to add feet, acres, meters and hectares to
the shape's attribute table.
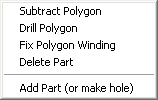
Notice
that the Edit Menu includes a Polygon Functions option:
(Note:
See the Polygon
Editing Tutorial.)
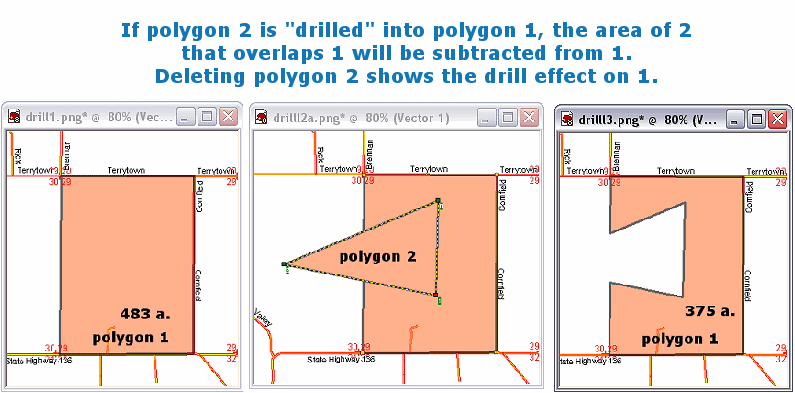
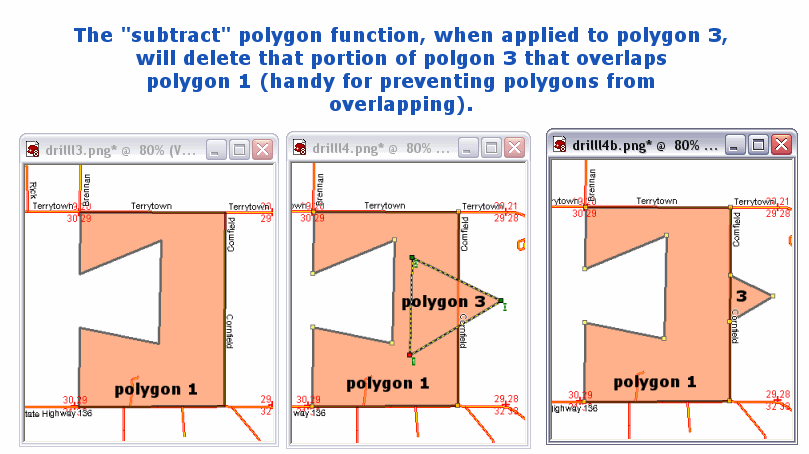
These
tools make it possible to digitize complex shapes in fGIS without
producing "orphans" or voids between shapes. See the
following examples (view sequence left to right):
The
"Fix Polygon Winding" command is used to reorder
the vertices of a polygon in a clockwise order. As a routine,
you should generally draw polygons in a counter-clockwise direction
(which causes the vertices to be numbered clockwise). When vertices
are numbered clockwise, the polygon can be split or manipulated
in many ways. If you forget, however, and need to fix the winding
of the vertices, use the "Fix Polygon Winding" tool.
The
"Delete Part" removes the selected polygon.
The
"Add Part (or make hole)" tool is used to make
islands, lakes and other donut holes within shapes. To make
a hole, first choose to make a New Shape, then click "Polygon
Functions>Add Part". You will immediately see the
hole in an underlying polygon if you digitize in a clockwise direction
(opposite the normal procedure, making the vertices wound
[numbered] counter-clockwise). To fill the hole with a lake,
the lake should be created in a separate layer by snapping to
the edges of the hole.
Note
the significant difference between using Add
Part and the Drill or Subtract functions. With Add
Part, the user must click that command first
and then digitize the hole. If digitized
clockwise, the hole appears immediately. If
digitized counter-clockwise (the "normal"
direction under other circumstances) clicking "Fix
Polygon Winding" will make the hole appear.
With
the other Polygon Functions, the user first digitizes
the new overlapping polygon, then clicks a
command to drill or subtract.
|
-
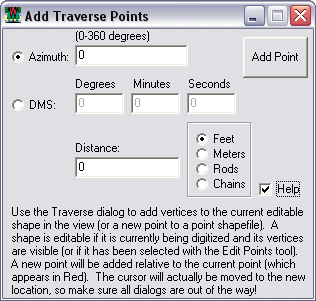
Traverse Tool 
Use the Traverse Tool to specify the direction
and distance of the next vertex in a line or polygon.
Designate the direction in azimuth degrees or degrees-minutes-seconds,
then enter the distance to the point in feet or meters. In
some instances, you may need to move the Add Traverse Points
dialog box so it doesn't block the view of the new point you
want to add. The Traverse Tool in fGIS can plot most simple
property deeds or layout a precise cruise course (which you
could transfer to a Garmin GPS unit with the DNR Garmin Tool).
|
NOTE:
Polygon areas in fGIS are calculated with math functions,
but screen resolution and zoom scale will have an effect
on the precision of vertex coordinates. The higher the
screen resolution (1024x768 is better than 800x600)
and the larger the scale (the further in you've zoomed),
the more precise the coordinates of vertex points that
the user creates will be (and the more accurate the
area measurement generated by fGIS).
|
-
Undo/Redo

Click
undo to remove an incorrect vertex or to restore a deleted
point when making or editing a shape. The Undo/Redo Tools
do not work with any other function.
-
Snap
When
digitizing a shape, you can enable snap to objects in any
vector layer by selecting the appropriate layer in the drop-down
list. The vector layer names used in the map legend will be
displayed as in this example:
The
snap layer can be changed at any time. For example, you might
start by snapping to a road layer, then snap to a stream when
the object you are digitizing approaches objects in the hydro
layer. Note: fGIS only snaps to object vertices.
|
|
|
|
|